About this episode
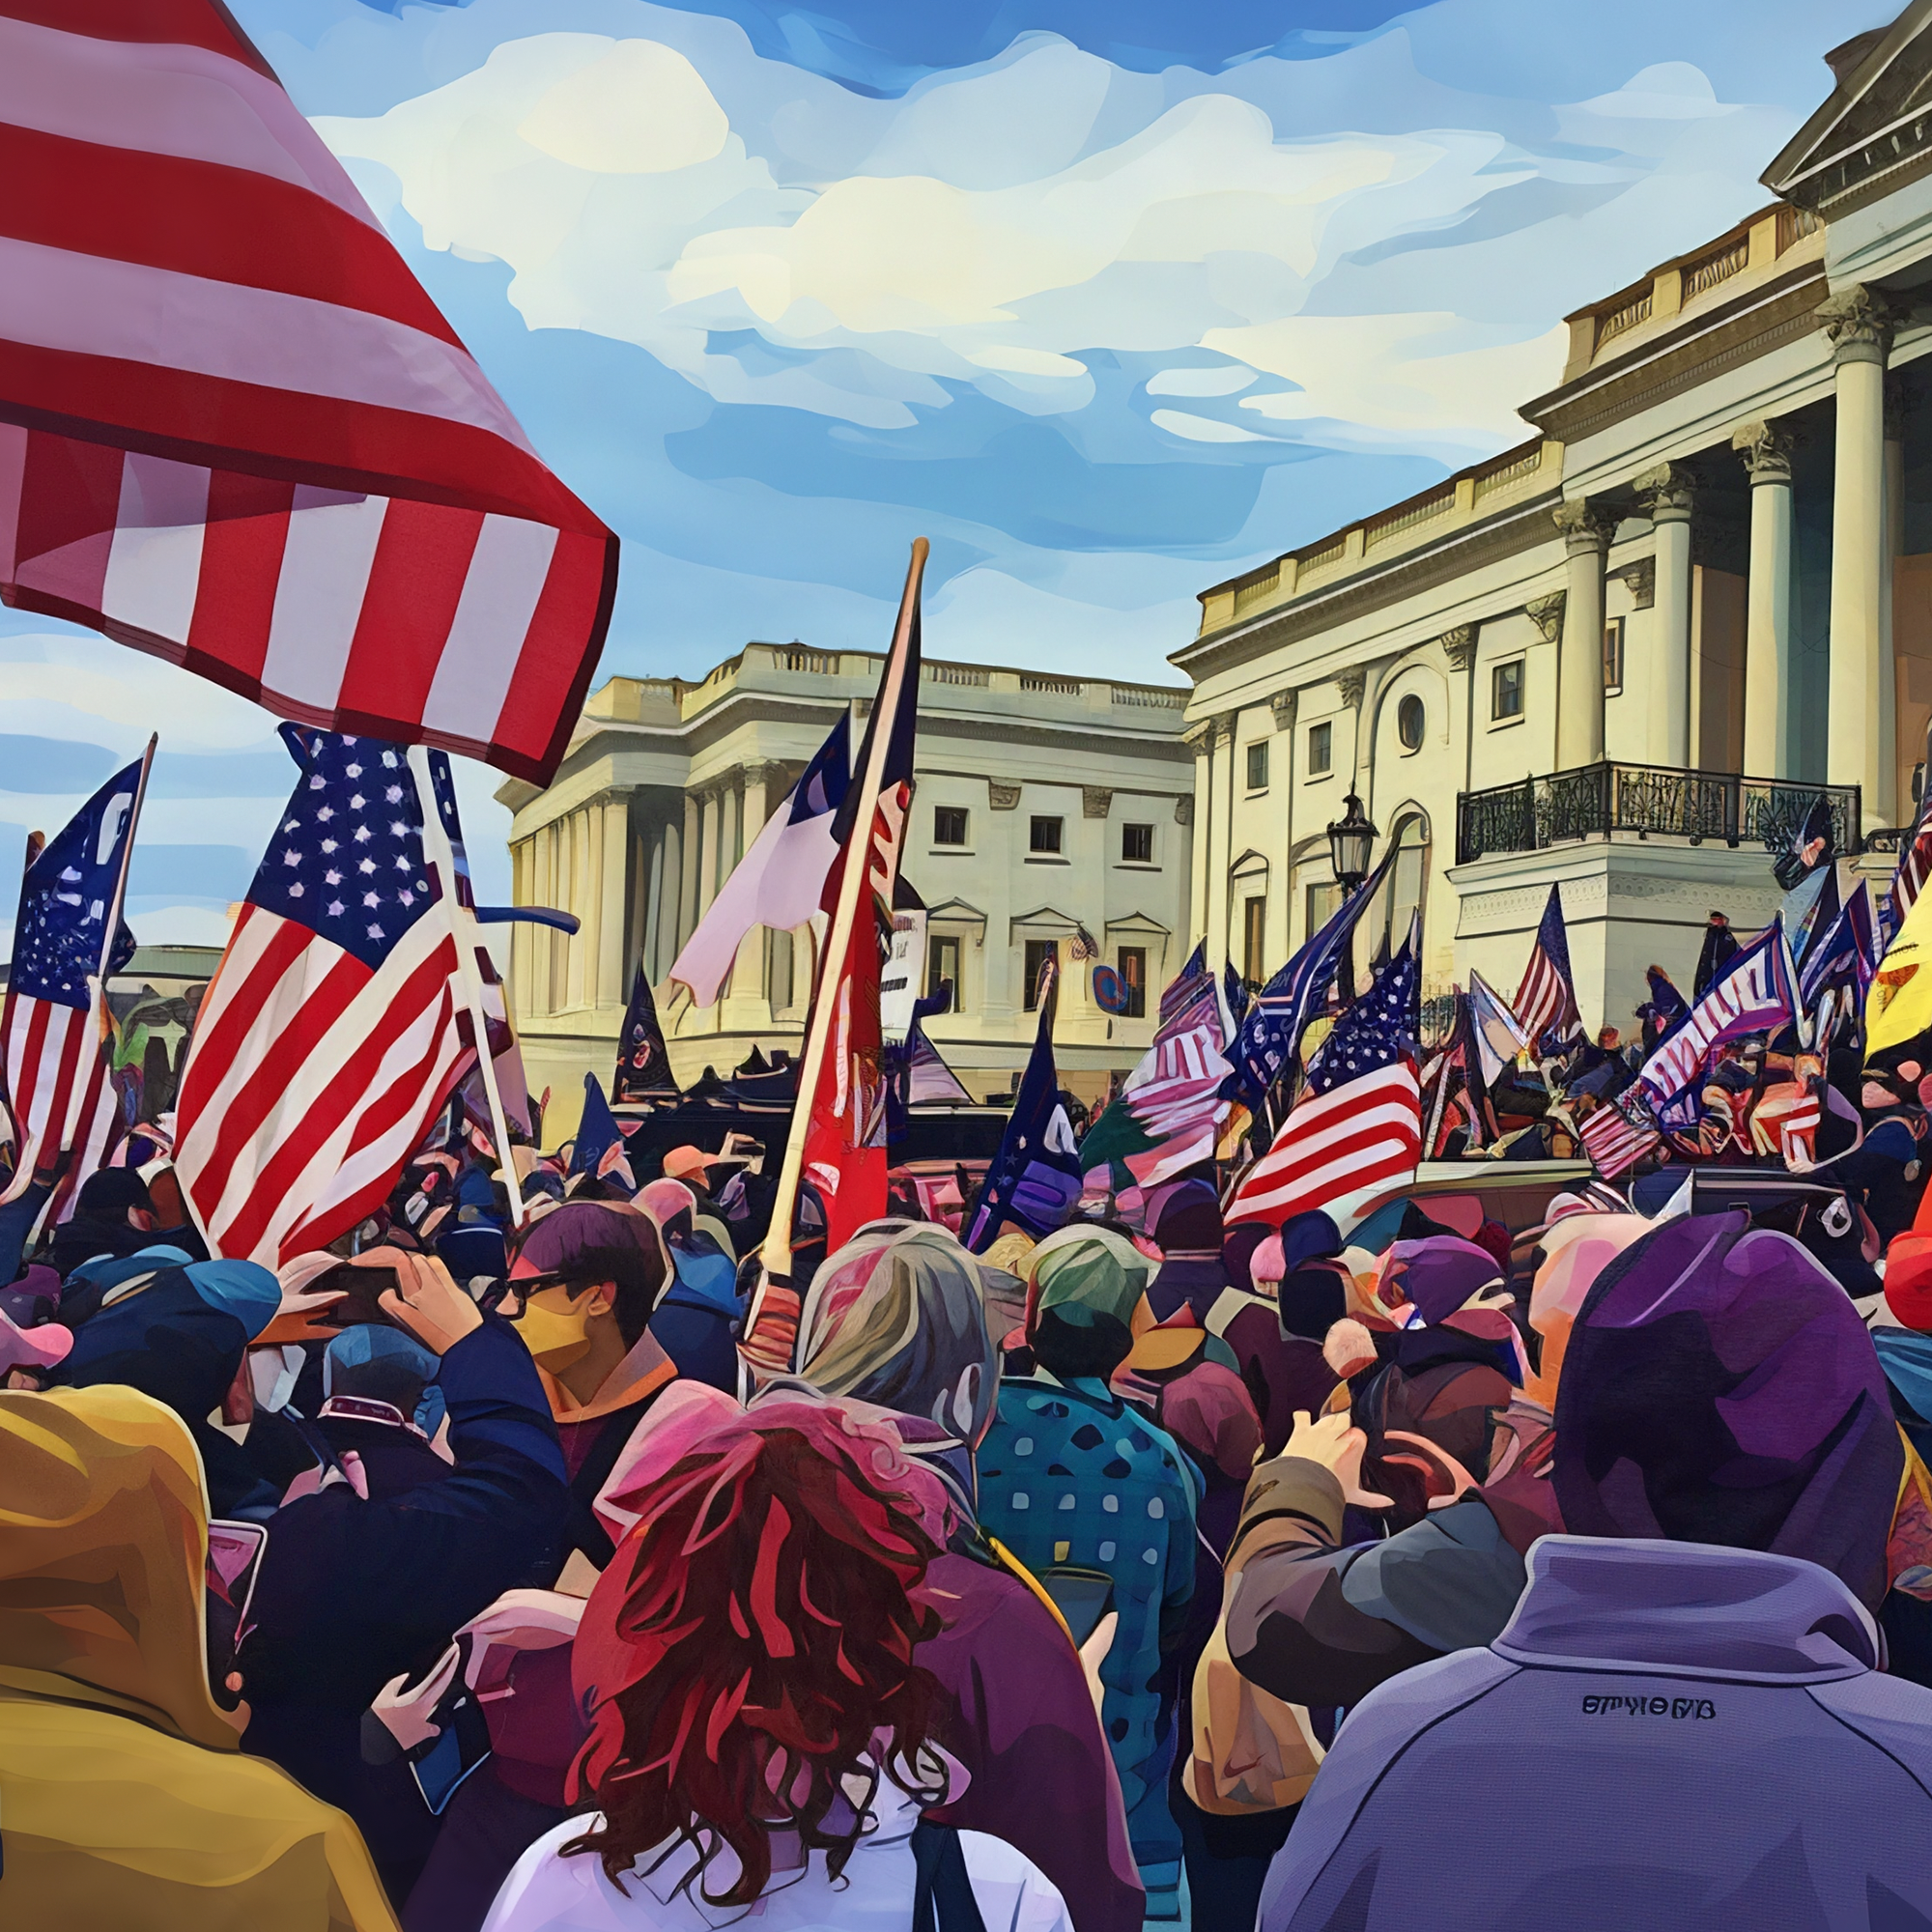
Two explanations circulated immediately after the March to Save America on January 6, 2021 turned into a riot: a mob manipulated by a demagogue, or ordinary citizens defending democracy against a stolen election. Konstantin Sonin, David Van Dijcke, and Austin Wright have used anonymised location data from forty million mobile devices to investigate why the protests escalated so dramatically.No surprise: partisanship was the strongest predictor of attendance, proximity to Proud Boys chapters and use of the far-right social network Parler also increased participation. But political isolation amplified the movement: the communities most over-represented among those who traveled to Washington were small Republican enclaves surrounded by Democrat-leaning areas, politically and socially cut off from their neighbours. And participation also spiked in counties that experienced a "midnight swing," where the reported vote count favoured Trump on election night before shifting to Biden as mail-in ballots were counted. These were precisely the counties where the "Stop the Steal" narrative landed hardest. The research behind this episode:Sonin, Konstantin, David Van Dijcke, and Austin L. Wright. 2023. "Isolation and Insurrection: How Partisanship and Political Geography Fueled January 6, 2021." CEPR DP18209. To cite this episode:Phillips, Tim, and Konstantin Sonin. 2026. “What triggered January 6?” VoxTalks Economics (podcast). Assign this as extra listening. The citation above is formatted and ready for a reading list or VLE.About the guestKonstantin Sonin is the John Dewey Distinguished Service Professor at the Harris School of Public Policy at the University of Chicago. Born in the Soviet Union, he has spent his career studying how political institutions work under stress, with particular attention to how information and misinformation shape political behaviour, elections, and collective action. He is one of the leading economists working on the political economy of authoritarian and democratic governance, and his research on protest, polarisation, and political geography has made him a central figure in the study of democratic backsliding.Research cited in this episodeRegression discontinuity design is a statistical method used to identify causal effects by exploiting a threshold or cutoff. Sonin, Van Dijcke, and Wright use two regression discontinuity designs: one exploiting the narrow margins by which Trump lost certain states, and one exploiting the gap between the election-night vote tally and the final certified result in individual counties. In both cases, the design allows them to isolate the effect of a specific trigger on protest participation, separating it from the general bac